Analysis of score at F2D Combat
First published: "LINA #1 2008" - Last update: 5/4 2012
model magazine "LINA" back in 2008
| Combat Statistics |
||
|
I have been looking into my archives and came across a document stamped "Top Secret".
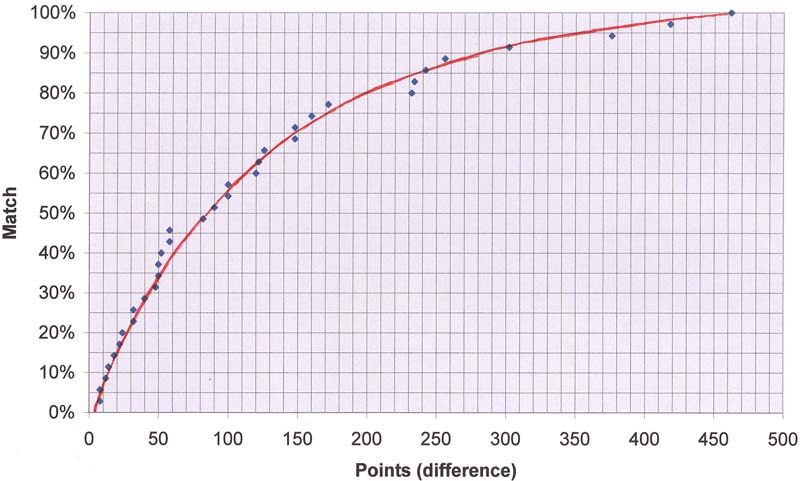
The document contained some statistical information that could help all combat pilots to significantly improve their results. Since "LINA Magazine" is only (!) published in Swedish I do not see a big risk in spreading this information and I have now chosen to publish the document. The statistic was made on the difference in scores at all heats at Nordic Championship in Karlskoga 2006. The graph shows the distribution of number of heats and the difference in score between the winner and loser. The curve does not go through the origin because the heats with a score difference of 5 points or less gives a reflight. Only the score from decisive heats are used here. |
This statistics was first published in the Swedish model magazine "LINA" in 2008 Here is the original artikel (in swedish!): Lina 2008, Issue 1, page 23 The statistics was based on the result from the Nordic championship 2006. Results from the competitions here. |
|
|
||
|
It can be seen that approximately 50% of all heats are determined by a difference of less than 100 points.
This means (statistically speaking) that the outcome of half the heats could be changed by an extra cut.
However, it is maybe more interesting to look at the small score differences that determine a number of heats. If, for example, you could teach your mechanics to be 15 seconds faster than usual you would get 30 points extra. Statistically, this would change the outcome in 25% of the heats! Something to consider for next season? |
Mark Rudner did also have some comments on this statistics in his news letter: Mark Rudner's F2D News November 2008 |
|
Is this what the mechanics should focus on? |
||
|
Update 5/4 2012:
This statistics was based on data from a competition under the old rules when 5 points were the limit for a reflight. That's why the graph intercepts 0% at 5 points. Matches that ended with a result between 0 and 5 points were reflown. If we look at the amount of matches that ended with a low difference in points we find that 6% ended with a difference of 10 points or less and 12 % ended with 12% or less. A good guess would then be that 6% of the bouts ended with a result between 0 and 5 points. Now the threshold for reflights has been changed to 10 points. According to this analysis 12 % of the bouts should now be reflown due to a tie in points. Some matches are also reflown as a result of errors by the officials or technical issues like a streamer folding over the wing or hopeless line tangles. Actual data from the World Cup competition in Novomoskovsk last year show a 13.3% rate of reflights At the European Championship in Poland the reflight rate was 14.8%. A good assumption is that 15% of the matches are reflown. That is roughly one reflight for every seven matches. |
Facts: European Championship 2011 122 heats and 18 reflights 14.8 % Novomoskovsk 2011: 150 heats and 20 reflights 13.3% Reflights: Rule book: 4.4.11 |
|
|
-oOo- |
||